

For the last 36 years, the Cook Political Report has handicapped the Electoral College with our ratings chart — placing states and districts in categories of Toss Up, Lean, Likely and Solid Republican/Democrat.
Today, we list:
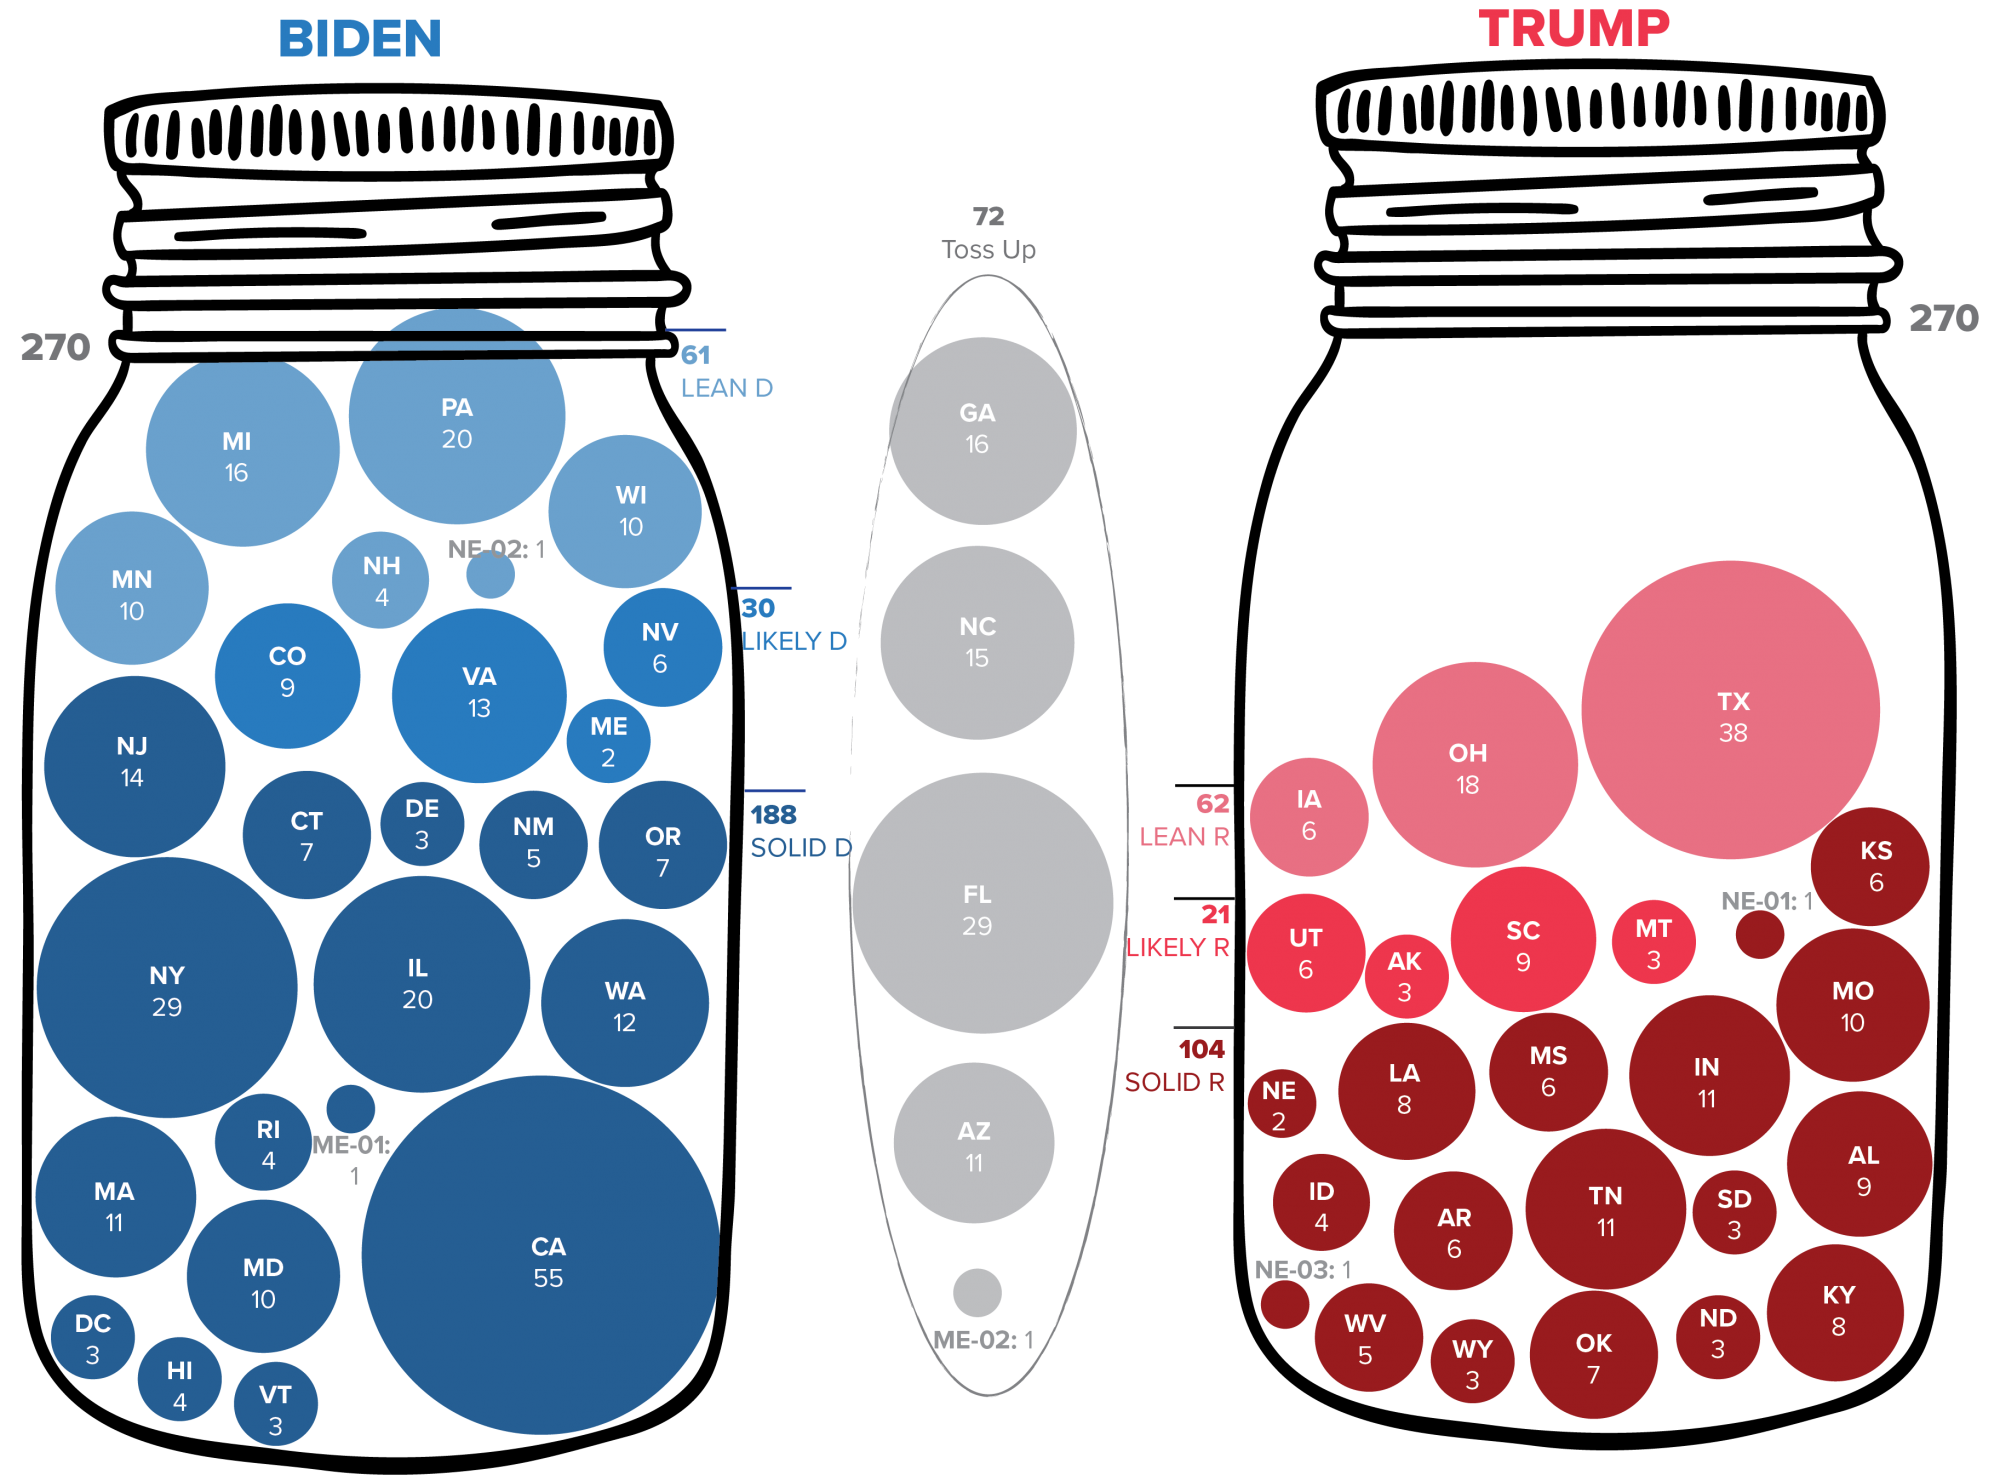
- 279 electoral votes in Lean, Likely and Solid Democrat
- 72 electoral votes in Toss Up
- 187 in Lean, Likely and Solid Republican.
Last week, we made some significant shifts. This week, we moved Maine's 2nd district from Lean Republican to Toss Up. We also moved four states, Alaska, Montana, South Carolina and Utah, from Solid Republican to Likely Republican. Click here to see our updated ratings chart.
Our Latest Electoral College Ratings:
We also realize that there are more dynamic ways to illustrate the electoral path to the White House. One such way is this graphic, which estimates the sequence of the likelihood of each party winning each state or district from DC as the most Democratic to West Virginia as the most Republican.
String Theory: Stringing Together the Path to 270
Click here to download the PDF version of this chart.
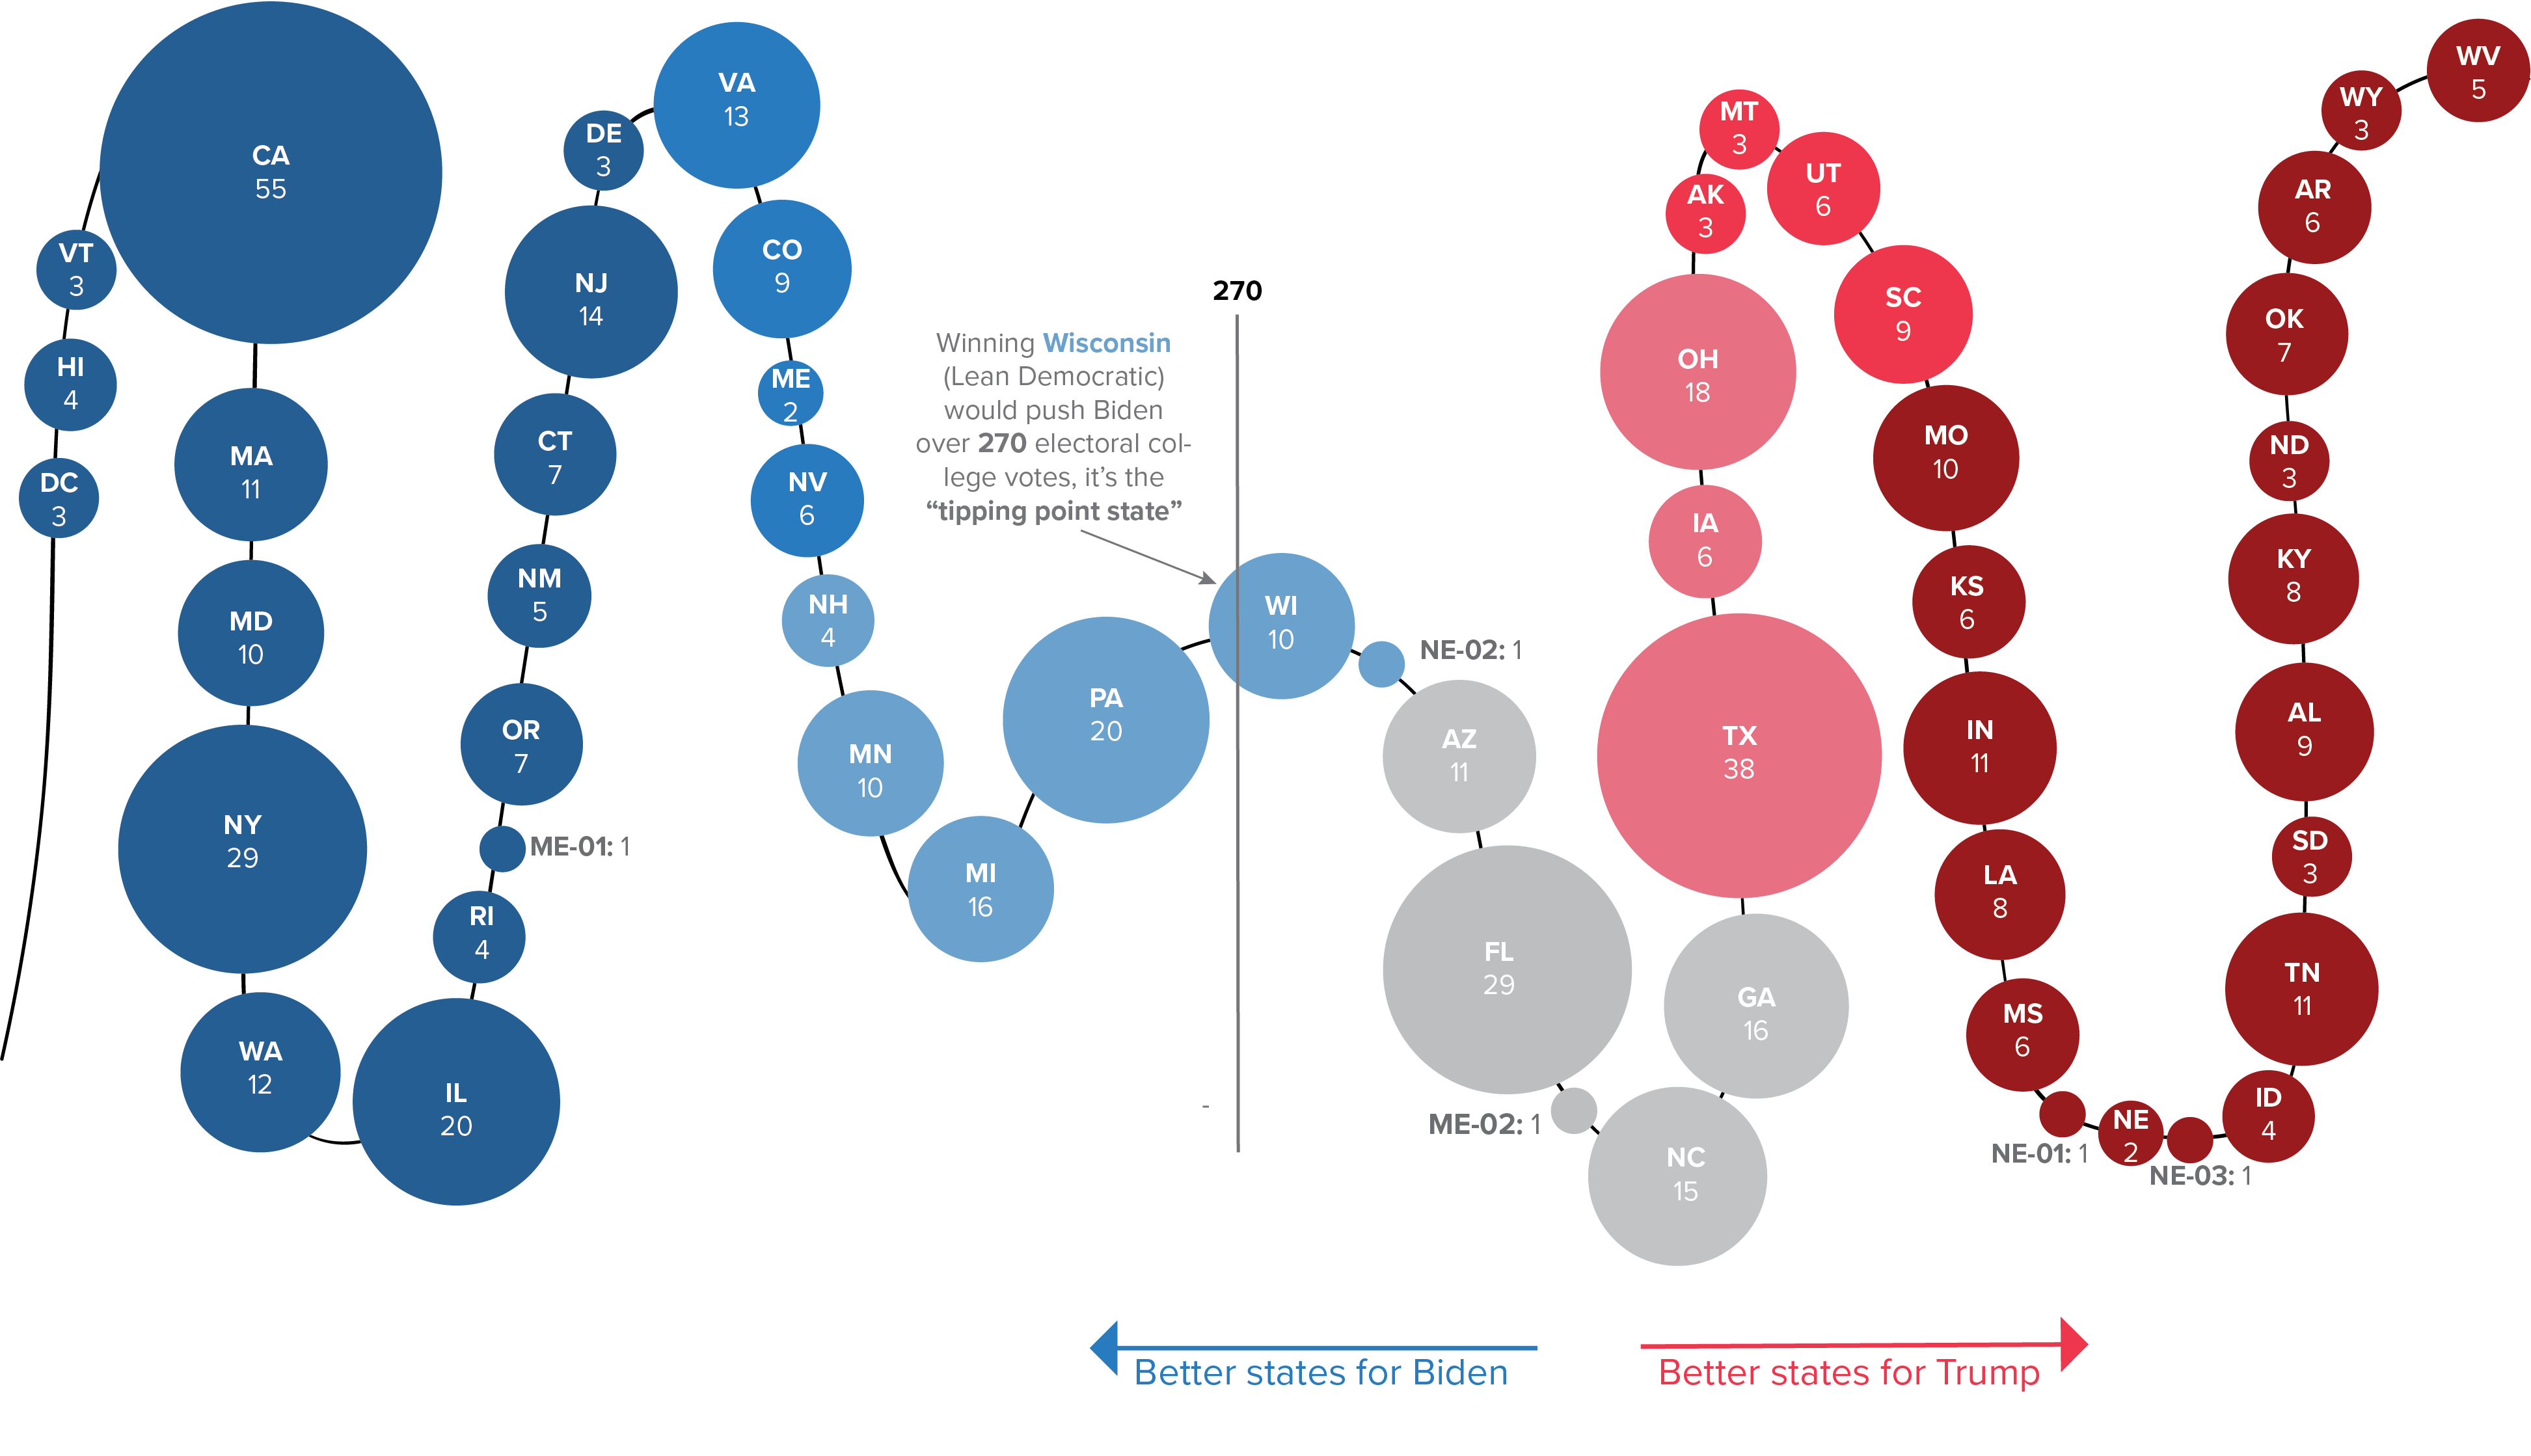
The colors correspond to our ratings. The darker the shade of blue, the more likely it votes Biden, the darker shade of red, the more likely it is a Trump state. The size of each pearl represents the number of electoral votes that the state or district has. The bigger the circle, the more electoral votes.
At the center of this string are the most competitive states: the states that are most likely to determine the winner of the presidential election.
Currently, Wisconsin is the "tipping point" state; the state gives Biden enough electoral votes to claim an Electoral College victory. For President Trump to get to 270, he needs to win all four states and one district that are in the gray zone (Toss Up) Arizona, Florida, North Caroline, Maine's 2nd CD and Georgia but also capture two that sit in blue — Wisconsin plus one other electoral vote (such as Nebraska's 2nd district).
We want to acknowledge that other organizations have used this type of graphic to make sense of the electoral college dynamics, including FiveThirtyEight and the Democratic SuperPAC Priorities USA.
To further illustrate the gap between Biden and Trump in our ratings, we created one more visualization. In this graphic, electoral votes fill up both Biden and Trump's "jars." By collecting the states rated Solid, Likely and Lean Democrat Biden has 279 Electoral College votes — enough votes to overfill his jar without needing to touch the Toss Up states in the middle.
Catch Them All: Collecting 270 Electoral Votes
Click here to download the PDF version of this chart.


Subscribe Today
Our subscribers have first access to individual race pages for each House, Senate and Governors race, which will include race ratings (each race is rated on a seven-point scale) and a narrative analysis pertaining to that race.