

Digital advertising has long been described in semi-mysterious terms. Both the Obama and Trump campaigns credited their victories to groundbreaking digital advertising strategies. However, until recently, none of this data was publicly available. But in 2018, Facebook and Google made their political ad spending data public following the testimonies of their executives on Capitol Hill. This allowed for unprecedented insight into how political campaigns used large digital vendors for the entirety of the 2019-2020 political cycle. Our research shows that political advertisers use Facebook and Google primarily as fundraising venues early in a campaign, before shifting their efforts to Get Out the Vote (GOTV) and persuasion style advertising in the later stages of a race. We can also see what percentage of all 2019-2020 advertising was made up by the approximately $1.7B spent on Facebook and Google.
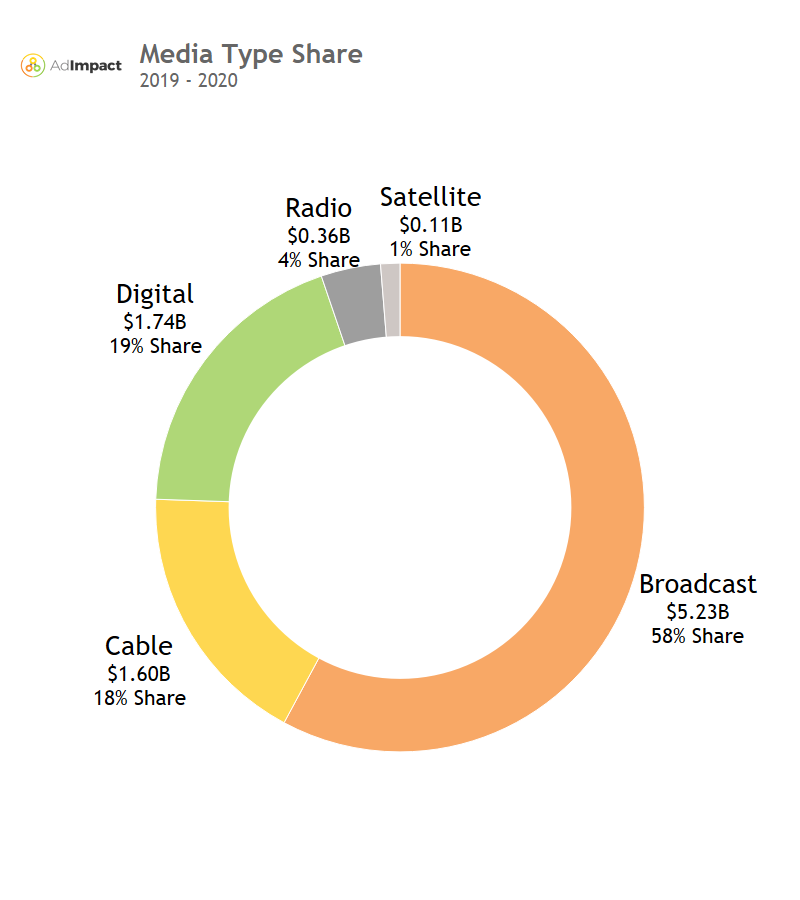
Political advertising hit record highs during the 2020 cycle, surpassing $9B for the first time. While broadcast TV remains the dominant way to reach voters, Facebook and Google now make up the second-largest piece of the pie at 19%, just surpassing cable TV. As more digital advertising platforms publicize their political spending, we expect to see this share grow in future years. Despite competition with television shares, digital advertising will likely lead to increased television spending in the long run. Much of digital advertising is Direct Response (DR), or fundraising and list-building, which raises dollars that can then be put back into digital, television, radio and other traditional advertising avenues.
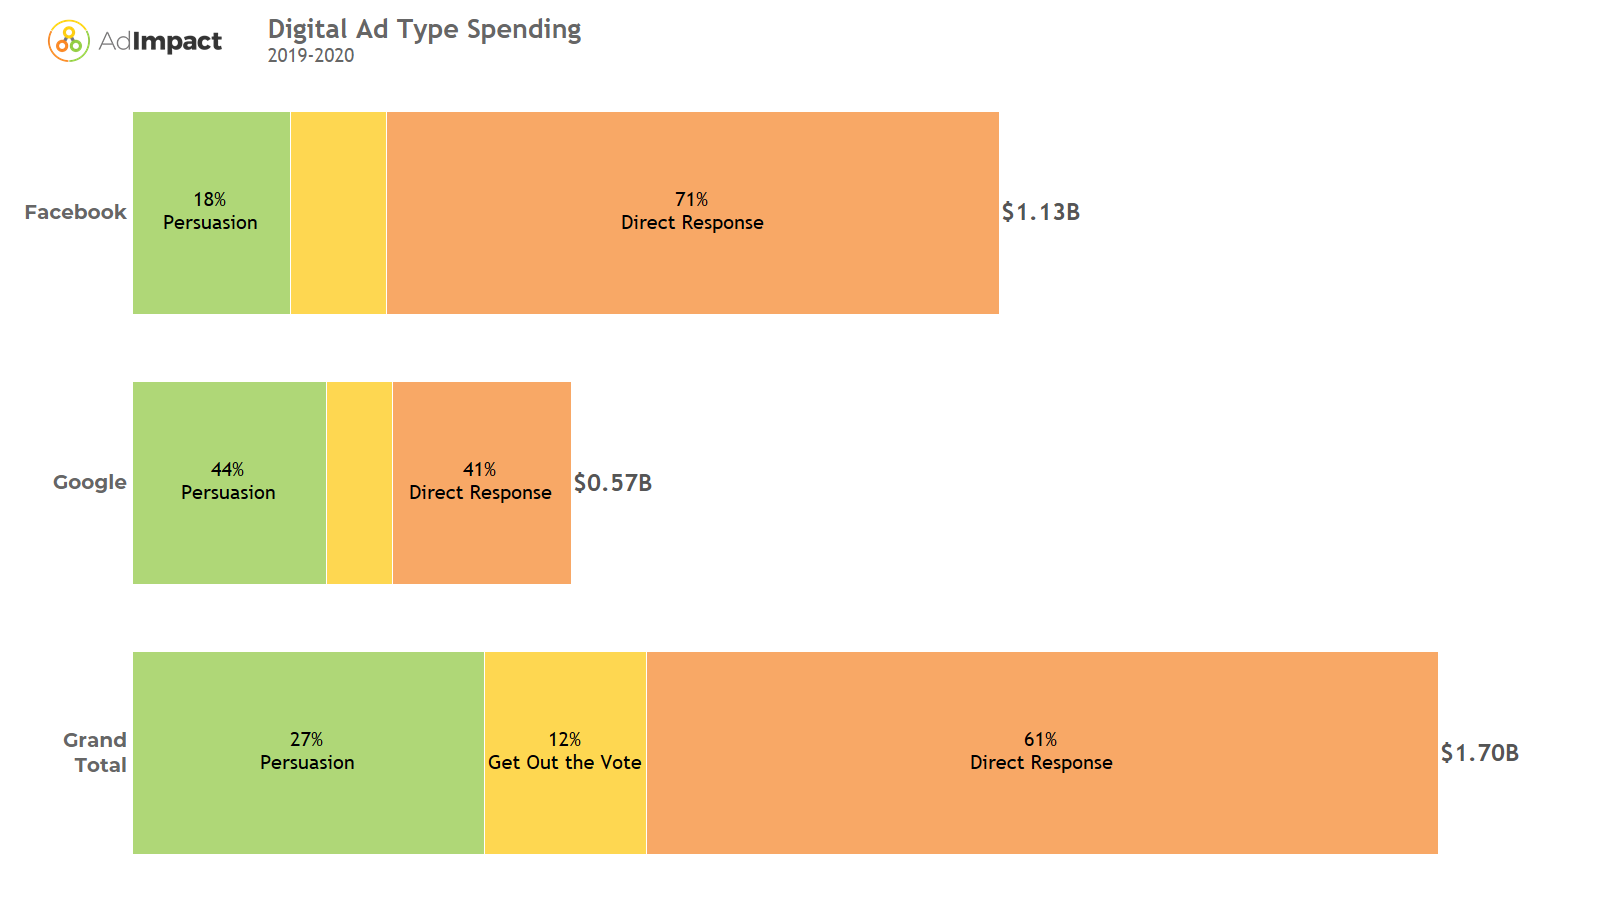
This is evident in the chart above: Over 60% of spending on Facebook and Google is Direct Response advertising. This type of spending aims to raise money and build lists that can then be tapped for future fundraising efforts. Persuasion advertising, which is mostly television-style video ads, makes up a much smaller portion of digital advertising, only 27% of advertising on these platforms. This does differ by platform. Though Google sees less political advertising than Facebook, a much higher percentage, 44% vs. 18%, respectively, goes to persuasion-style advertising. This is likely because Google-owned platforms like YouTube are better suited to television-style ads.
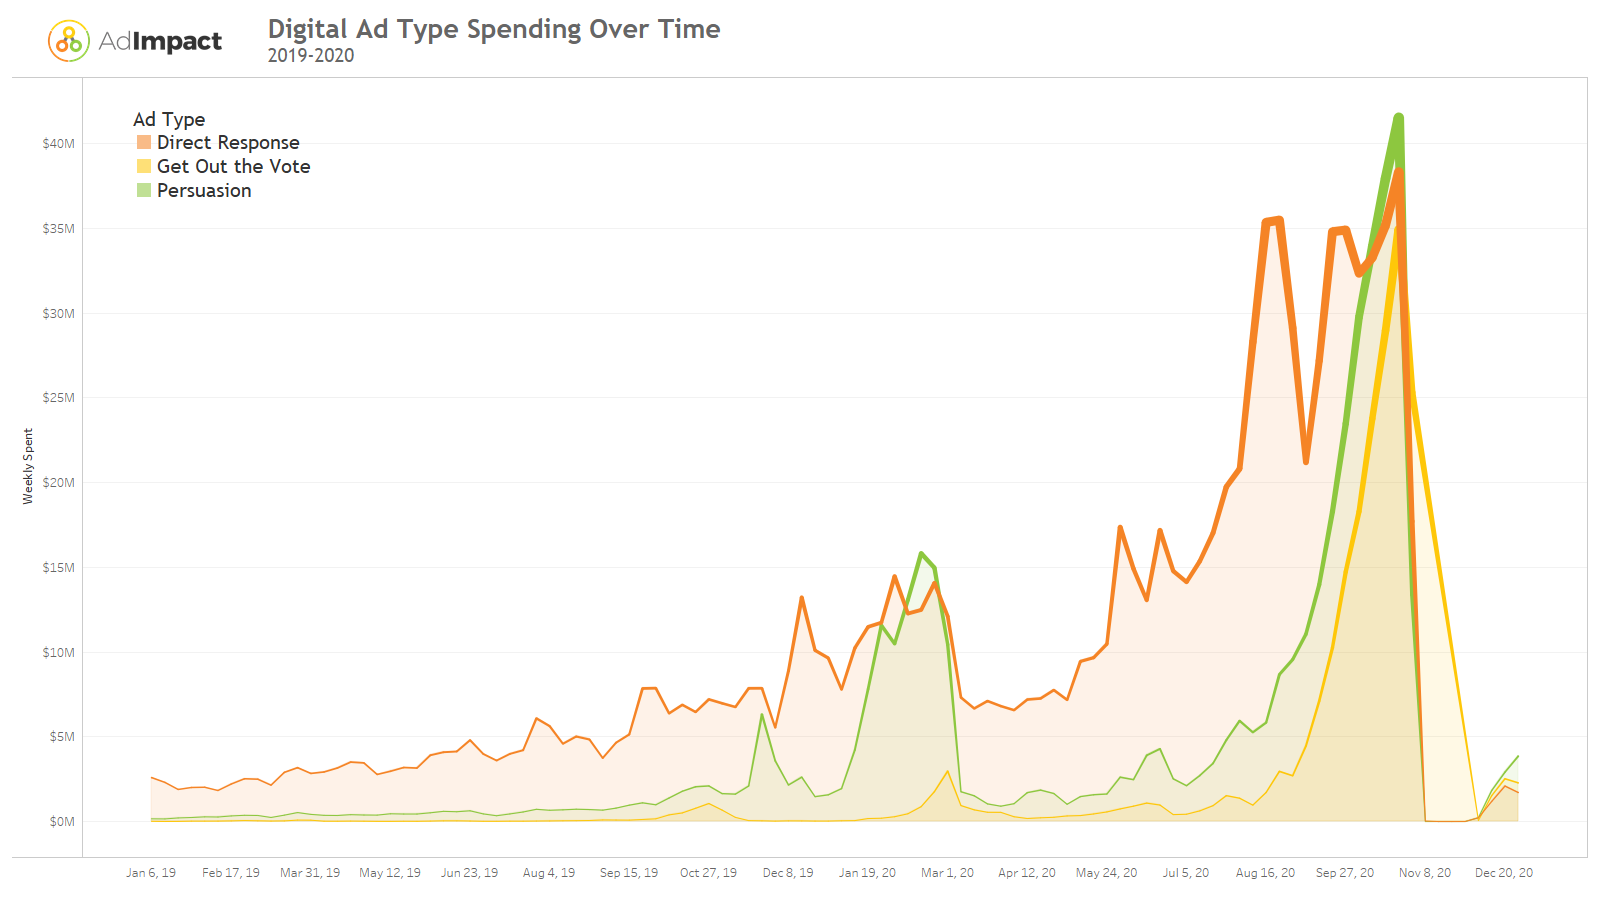
As we look at digital spending broken out by ad type in the chart above the relationship between digital ad types becomes clear. Early in the cycle, Direct Response advertising (in orange above) made up most digital ad spending. Persuasion advertising (in green) spiked the week Mike Bloomberg entered the race, and again in the weeks leading up to Super Tuesday. Following a brief dip during the strictest part of the Covid-19 lockdowns, Direct Response advertising shots back up. Persuasion and Get Out the Vote increased but trailed Direct Response until the very end of the election. At that point, Persuasion made up the majority of digital advertising, and Direct Response ads transitioned to Get Out the Vote as campaigns urged loyal donors to vote and informed them how to do so.
As we can see, digital advertising is a crucial part of the political advertising landscape. Campaigns invest early in Direct Response advertising to raise funds and create large donor lists that can be tapped again later. This money is then converted to Persuasion and Get Out the Vote ads around Election Day and TV and radio ads. Digital advertising is a major component of political advertising. We expect its usefulness to campaigns will only increase from here forward. For a deeper dive into digital advertising, check out our interview with Vice President at Smart Media Group, Kurt Pickhardt.


Subscribe Today
Our subscribers have first access to individual race pages for each House, Senate and Governors race, which will include race ratings (each race is rated on a seven-point scale) and a narrative analysis pertaining to that race.