Introducing the 2017 Cook Political Report Partisan Voter Index
April 7, 2017 | David Wasserman and Ally Flinn
The Cook Political Report is pleased to introduce the 20th anniversary edition of the Partisan Voter Index (PVI) for all 50 states and 435 Congressional districts in the country, compiled especially for the Report by POLIDATA®. First introduced in 1997, the Cook PVI measures how each district performs at the presidential level compared to the nation as a whole. We have released new PVI scores following every election since 1996 and every round of redistricting since 2001, each time taking into account the prior two presidential elections.
This 2017 release has updated our PVI scores to incorporate the results of the November 2016 presidential election. A Partisan Voting Index score of D+2, for example, means that in the 2012 and 2016 presidential elections, that district performed an average of two points more Democratic than the nation did as a whole, while an R+4 means the district performed four points more Republican than the national average. If a district performed within half a point of the national average in either direction, we assign it a score of EVEN.
View the full 2017 Partisan Voter Index in three different formats below:
2017 Partisan Voter Index by State and District »
2017 Partisan Voter Index by Member Name »
2017 Partisan Voter Index by Partisan Rank »
2017 Partisan Voter Index Scores by Congressional District
The 2016 Presidential Election by Congressional District
In 2016, for the second election in a row, the Republican presidential nominee carried the majority of congressional districts while losing the national popular vote. President Trump carried 230 districts to Hillary Clinton’s 205, up four from Mitt Romney’s tally of 226 districts in 2012. This helps explain why House Republicans won 49 percent of all votes to House Democrats’ 48 percent in 2016 yet won 47 more seats.
The House has become well-sorted out: only 35 of 435 districts "crossed over" to vote for presidential and House candidates of opposite parties, down from 108 in 1996. Today, there are 23 Republicans sitting in districts Clinton carried, and 12 Democrats sitting in districts Trump carried. However, this is slightly higher than the record low of 26 "crossover districts" following the 2012 election.
Despite a similar overall breakdown to 2012, there was considerable change: 36 of 435 districts switched partisan preferences at the top of the ticket. There are 21 districts that voted for both President Obama in 2012 and President Trump in 2016, including 12 held by Republicans and nine held by Democrats. There are also 15 districts that voted for both Mitt Romney in 2012 and Hillary Clinton in 2016—all held by Republicans.
The Decline of the “Swing Seat”
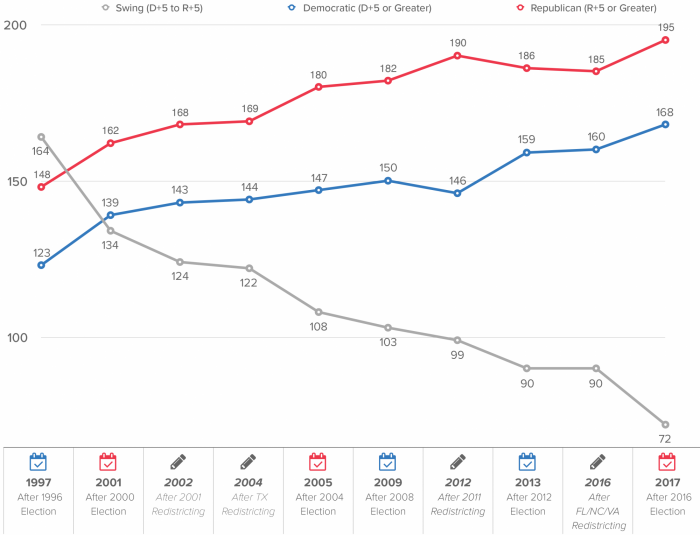
The most striking House statistic in the last 20 years may be the decline of competitive districts, places where members have the greatest political incentives to work on a bipartisan basis. In 1997, our Partisan Voter Index scored 164 districts between D+5 and R+5, more than a third of the House, and greater than both the number of strongly Democratic and strongly Republican seats.
After the hyper-polarized 2016 election, there are only 72 districts between D+5 and R+5—less than one sixth of the House and a 56 percent decline since 1997. This also represents a 20 percent decline from just four years ago, when there were 90 swing seats.
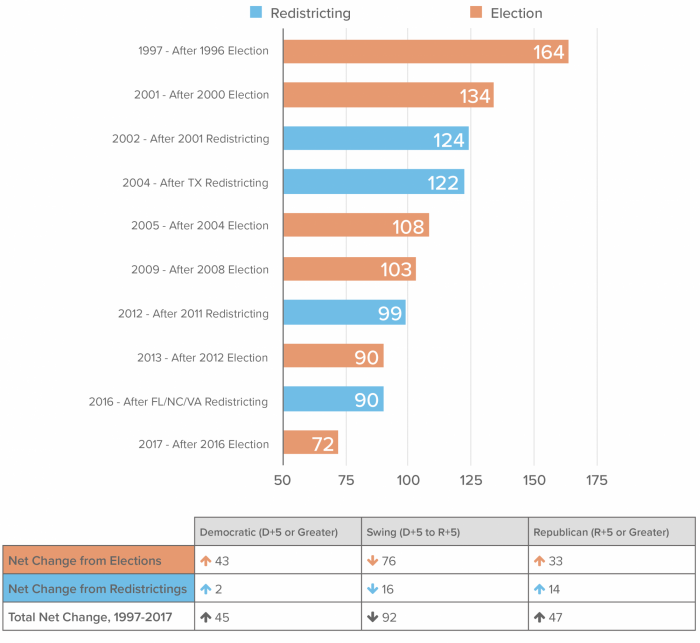
The Incredible Shrinking Swing Seat, 1997-2017
Redistricting is only responsible for a small portion of this swing seat decimation. In many minimally altered districts, the electorate has simply become much more homogeneous. For example, the boundaries of West Virginia’s 2nd CD have barely changed since 1997, but its PVI score has shifted from EVEN to R+17 as its voters have moved away from the national Democratic brand. Likewise, Albuquerque’s migration to the left has bumped the PVI score of New Mexico’s 1st CD from R+1 to D+7.
The Cook PVI illustrates how voters’ natural geographical sorting from election to election, much more than redistricting and gerrymandering, has driven the polarization of districts over the last two decades. Our ten unique sets of PVI scores over the past 20 years give us a powerful tool to isolate and quantify the impacts of sorting and redistricting on the makeup of House districts.
The Cook Political Report has released updated PVI scores in six odd-numbered years following presidential elections: 1997, 2001, 2005, 2009, 2013 and 2017. We also released updated PVI scores in four even-numbered years following redistricting: 2002 (after the 2000 Census), 2004 (after mid-decade redistricting in Texas), 2012 (after the 2010 Census) and 2016 (after new court-ordered maps in Florida, North Carolina and Virginia).
As it turns out, gerrymandering wasn’t as much of a factor in the House’s polarization as some redistricting reform advocates might argue. Of the 92 “Swing Seats” that have vanished since 1997, 83 percent of the decline has resulted from natural geographic sorting of the electorate from election to election, while only 17 percent of the decline has resulted from changes to district boundaries.
The Impact of Elections vs. Redistricting on PVI Scores, 1997-2017
More evidence voters are choosing sides with their feet: in the 2016 election, 78 percent of Democratic-leaning seats grew even more Democratic and 65 percent of Republican-leaning seats grew even more Republican.
As a result, the two parties’ House constituencies have drifted even farther apart: whereas the median Democratic-held seat had a D+7 PVI score in 1997, the median Democratic seat has a D+14 PVI score today. The median Republican-held seat had an R+7 PVI score in 1997; the median Republican-held seat has an R+11 PVI score today. In other words, the gap between the two parties’ median districts has grown from 14 to 25 points.
This is not to say redistricting hasn’t had a big impact. Sorting has enhanced partisan mapmakers’ ability to partition states into safe seats. And on a net basis, redistricting has helped bolster Republicans’ edge in the House: the number of Republican (R+5 or greater) seats has grown by 14 as the result of changes to district lines, while the number of Democratic (D+5 or greater) seats has increased by just two.
Democrats also suffer because their voters are disproportionately clustered on the map. The most Republican district in the country is Rep. Mac Thornberry’s TX-13, with a score of R+33. But Democrats hold 20 districts with a PVI score of D+33 or greater. Overall, there are 241 House seats more Republican than the national average, and 194 seats more Democratic—mirroring the GOP’s advantage in seats after 2016.
The Rise of Straight-Ticket Voting, 1997-2017
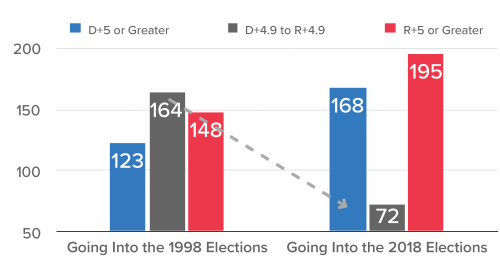
There is also strong evidence the “trading range” of what constitutes a truly competitive seat has narrowed over the past 20 years as split-ticket voting has declined. In 1997, Republicans held 12 of the 43 seats between D+2 and D+5 and seven of the 123 seats greater than D+5. Meanwhile, Democrats held 18 of the 53 seats between R+2 and R+5 and 11 of the 148 seats greater than R+5.
But in 2017, straight-ticket voting has almost totally taken over. Republicans hold just two of the 13 seats between D+2 and D+5 and just three of the 168 seats greater than D+5. Democrats hold just three of the 28 seats between R+2 and R+5 and just two of the 195 seats greater than R+5. The chart below illustrates how much more “sorted out” the House is now than it was 20 years ago:
In the modern era, it takes considerable personal appeal to win a House election in a district that fundamentally favors the opposite party. There are several members on both sides who have successfully run “against the grain.” However, these members are also likeliest to be among the top targets for the opposite party in 2018 and beyond:
The “Median District” and PVI Rankings
Another way of gauging the House is the concept of the “median district.” Because the Democratic vote tends to be more geographically concentrated in “safe” seats than the Republican vote, the median House district has always leaned slightly Republican since we introduced the Partisan Voter Index 20 years ago. In 1997, the median district was Washington’s 8th CD, which was one point more Republican than the national average.
In 2009, the median district was Wisconsin’s 1st CD, held by none other than Rep. Paul Ryan, with a PVI score of R+2. Today, the median district is New Jersey’s 7th District, held by GOP Rep. Leonard Lance, which has a PVI score of R+3. As the Democratic vote has become even more urban and Republicans have used the redistricting process to shore up their own seats, the “median district” has crept rightward by two points since 1997.
The most Democratic and most Republican districts have grown farther apart over the years. In 1997, the most Democratic seat in the House had a PVI score of D+38 and the most Republican seat had a score of R+26 - a 64 point gap. Today, NY-15 Rep. Jose Serrano holds the most Democratic district at D+44, while TX-13 Rep. Mac Thornberry holds the most Republican seat at R+33—a record 77 point spread.
What’s Changed: The Top Trending Districts
In 2016, Trump substantially redrew the electoral map. The 25 districts that shifted most dramatically towards the GOP between 2012 and 2016 are all located in a contiguous 10-state region stretching from the Northern Plains to the Great Lakes and Appalachia. Meanwhile, nearly half of the 25 districts that shifted the most towards Democrats are Latino majority seats, and 15 are in California and Texas.
The Most Republican, Democratic & Evenly Split Districts
In 2017, there are eight “Dead Center” districts with a PVI score of EVEN, including four held by Democrats and four held by Republicans. In 1997, there were 18 districts with a score of EVEN. However, it’s important to remember that even if Democrats were to win all 25 of the most evenly split districts, they would still fall short of winning the House majority because the median House seat has a score of R+3
The Cook Political Report Partisan Voter Index (PVI) Explained
In August of 1997, The Cook Political Report introduced the Partisan Voting Index (PVI) as a means of providing a more accurate picture of the competitiveness of each of the 435 congressional districts. Using the 1992 and 1996 major-party Presidential voting results, the PVI measured how each congressional district performed compared to the nation as a whole.
Using the results of the 2012 and 2016 elections for current Congressional boundaries that first took effect in 2012 (or 2016, in the case of court-ordered maps in Florida, North Carolina and Virginia), we have updated these PVI scores and have even more information to draw upon to understand the congressional level trends and tilts that will help to define the elections of 2018 and beyond.
Developed for The Cook Political Report by POLIDATA®, the index is an attempt to find an objective measurement of each congressional district that allows comparisons between states and districts, thereby making it relevant in both mid-term and presidential election years. We will next update PVI scores again in 2021 to reflect the results of the 2020 presidential election.
While other data such as the results of senatorial, gubernatorial, congressional and other local races can help fine tune the exact partisan tilt of a particular district, those kinds of results don’t allow a comparison of districts across state lines. Only presidential results allow for total comparability.
A Partisan Voting Index score of D+2, for example, means that in the 2008 and 2012 presidential elections, that district performed an average of two points more Democratic than the nation did as a whole, while an R+4 means the district performed four points more Republican than the national average. If a district performed within half a point of the national average in either direction, we assign it a score of EVEN.
To determine the national average for these latest ratings, we have taken the average Democratic share of the two-party presidential vote for 2012 and 2016, which is roughly 51.5 percent, and that of Republicans, which is roughly 48.5 percent. So, if Barack Obama carried 58 percent of the vote in a given district in 2012 and Hillary Clinton carried 55 percent in the district in 2012, the district would have a PVI score of roughly D+5.
In addition to the charts above, we have listed the PVI score for every district on each individual race page. It is important to remember that redistricting in 2012 and 2016 made significant changes to the congressional map that make it hard to compare current districts with their predecessors.
Notes about PVI Data & Methodology
Following each election and round of redistricting, presidential results are compiled to generate PVI scores for each congressional district. In a few states, these results are aggregated by district by state and/or local election authorities. However, in others they are not, and the reported election results do not account for some votes that are reported centrally and not redirected back to the voter’s registration precinct.
Subscribe Today
Our subscribers have first access to individual race pages for each House, Senate and Governors race, which will include race ratings (each race is rated on a seven-point scale) and a narrative analysis pertaining to that race.